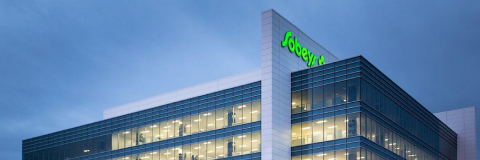
Empire Company Limited (TSX: EMP.A) is a Canadian company headquartered in Stellarton, Nova Scotia. Empire’s key businesses are food retailing, through wholly-owned subsidiary Sobeys Inc., and related real estate.
With approximately $30.7 billion in annual sales and $16.7 billion in assets, we employ approximately 128,000 people. Sobeys Inc. has more than 115 years of experience serving customers in the food retail business. Sobeys Inc. is one of only two national Canadian grocers operating across all 10 provinces with approximately 1,600 stores.
Sobeys Inc. oversees familiar banner names of Sobeys, Safeway, IGA, Foodland, FreshCo, Thrifty Foods, Farm Boy, Kim Phat, Longo’s, Lawtons Drugs, Ricardo and Voilà as well as more than 145 retail fuel locations. We also operate with five core retail food formats and related businesses to ensure we are able to satisfy the unique shopping needs of our customers: full service; fresh service; community service; discount service; convenience service.
Across our banners and businesses from coast to coast, Sobeys Inc. fosters a culture of care, trust, respect and growth for our people and customers and their communities. Together, our store teammates, franchisees and diverse retail networks are dedicated to serving customer needs by providing exceptional shopping and food experiences.
-
Teammates:
128,000
-
Total stores:
1,600
(excluding food stations and related convenience stores)
-
Total square footage:
43.0 million
-
Communities served:
900+
-


Financial Highlights
Sales
-
4.1%
5-year CAGR
-
3.9%
10-year CAGR(3)
Adjusted EBITDA(1)
-
16.7%
5-year CAGR
-
8.3%
10-year CAGR
Adjusted Net Earnings(1)(2)
-
10.7%
5-year CAGR
-
5.7%
10-year CAGR
Dividends
-
10.7%
5-year CAGR
-
7.7%
10-year CAGR
(1) See “Non-GAAP Financial Measures & Financial Metrics” section of Empire’s MD&A for a description of the types of costs and recoveries included.
(2) Attributable to owners of the Company.
(3) Compound annual growth rate.


